Things I wish I knew earlier about Distributed Tracing in Azure Application Insights
Previously I was tasked to ensure all of our micro-services were set up correctly with distributed tracing, although there were a lot of docs that mentioned the topic and gave some insight, none gave straight information on how it worked. Below details some things that would have made my job a lot easier if I knew them first up.
First thing: How it works
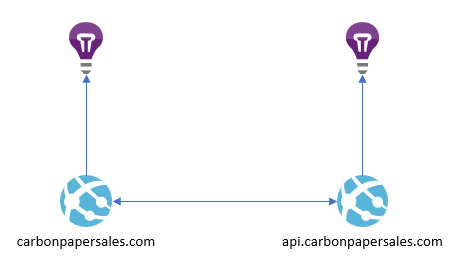
Let’s say you have a website selling carbon paper. This website calls a back-end service that checks a database and tells the website everything about all the varying carbon paper products there are, including if a particular type of carbon paper is in stock. Both the front-end and back-end send their telemetry to their own separate Application Insights instances.

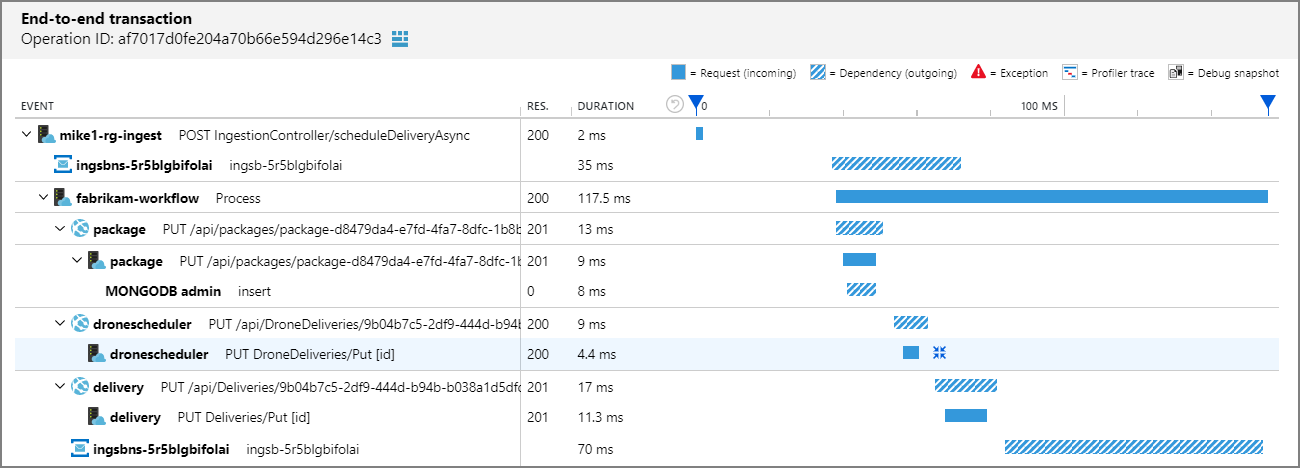
What distributed tracing does is link the two Application Insights instances so you can see all the entire session in a single place. With collapsible sections for all the dependency calls to your back-end services.
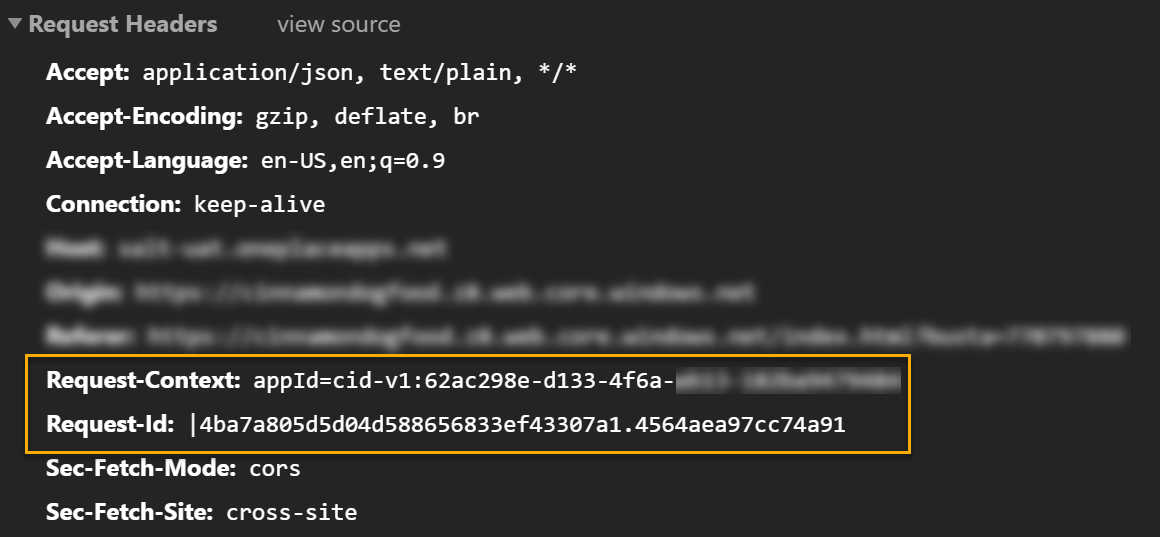
It does this by having the front-end add additional headers on all dependency calls to the back-end, specifically a Request-Id giving the operation id of the dependency and the Request-Context which holds (at least) the AppId of the calling Application Insights instance.
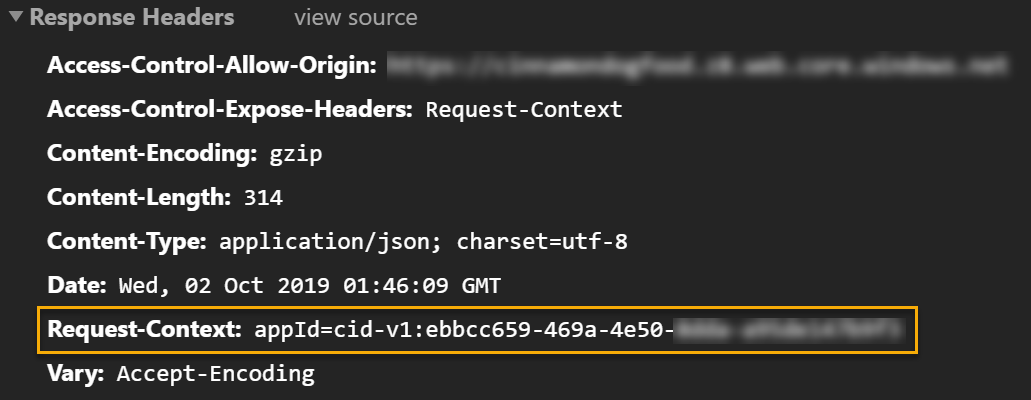
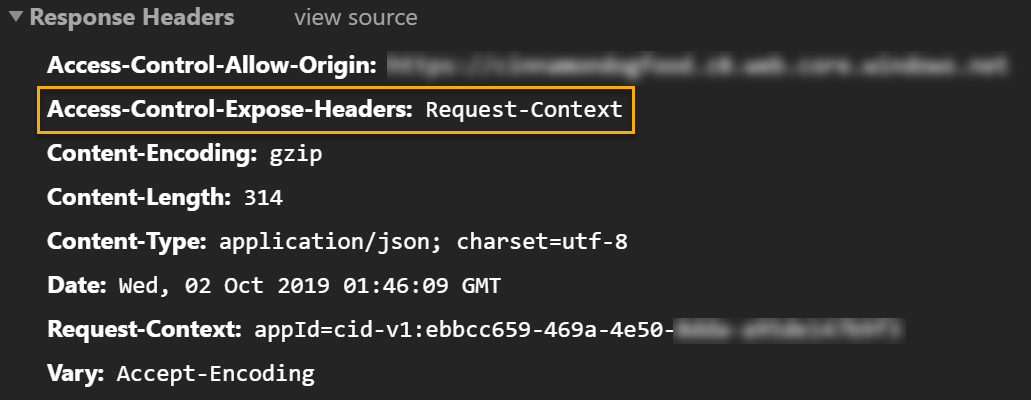
The back-end will then respond with a Request-Context holding the AppId of it’s Application Insights instance.
These things are then added to the telemetry sent to Application Insights as part of the target property in the format {back-end URL} | cid-v1:{AppId}
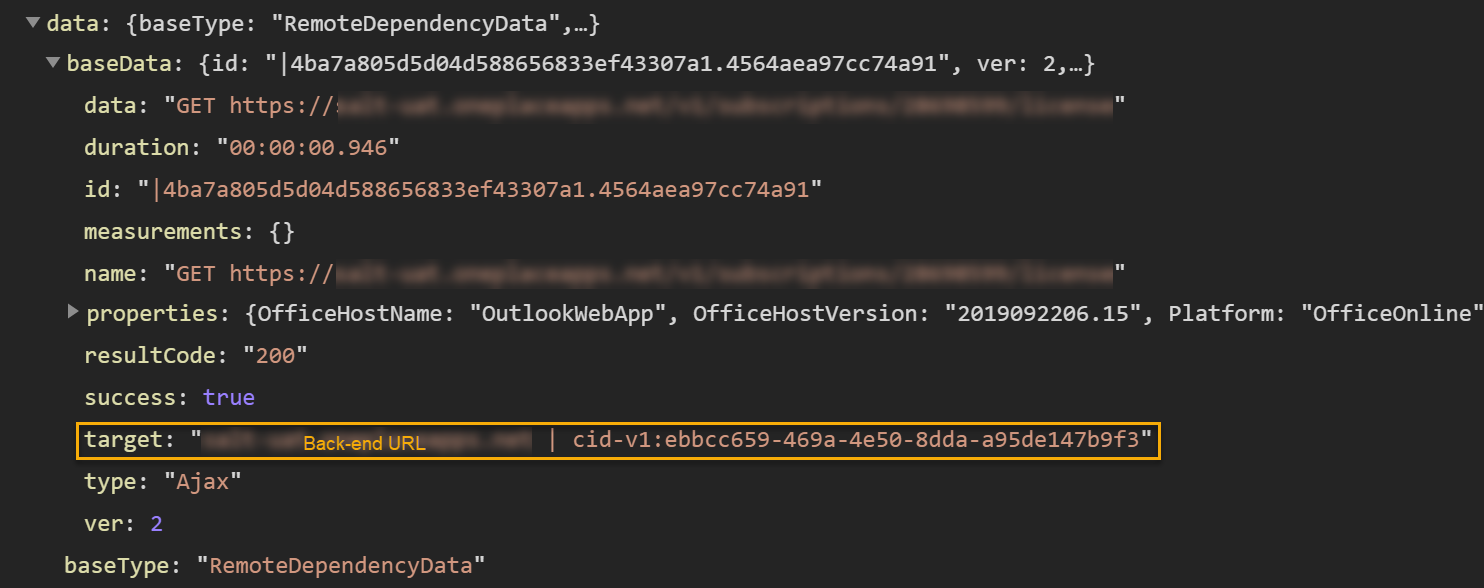
The AppId is the unique identifier of the AppInsights instance, but you can’t use it to create telemetry, for that you need the more commonly known Instrumentation Key.
Next thing: It’s not as easy to set up as they say it is
The official documentation for Distributed Tracing says:
Enabling distributed tracing across the services in an application is as simple as adding the proper SDK or library to each service, based on the language the service was implemented in. https://docs.microsoft.com/en-us/azure/azure-monitor/app/distributed-tracing
Sounds easy, right? Well they neglect to mention it is that easy only if your front-end and back-end are all on the same domain.
If your front-end (carbonpapersales.com) is on a different domain to the back-end (api.carbonpapersales.com) then you need to enable a bunch of CORS properties in order to get it to work.
Firstly, you need to set enableCorsCorrelation to true. Without this, no additional headers will be made to the request.
Secondly, you need to add Access-Control-Expose-Headers: Request-Context to the response headers on the back-end. This makes the returned AppId visible to the front-end to add to the telemetry information.
Last thing: The JavaScript libraries were broken until version 2.2.2
One thing that caught me out for a while was the JavaScript libraries were supposed to send the AppId of the back-end to Application Insights, but that bit was accidentally commented out until version 2.2.2.